By Denis G. Rancourt, Activist Teacher
Global warming is often presented as the greatest potential threat to humankind and as the greatest environmental and ecological threat on the planet. It is also presented as a problem that could be solved or contained by determined international collaboration - by political will if it were present. I argue: (1) that global warming (climate change, climate chaos, etc.) will not become humankind’s greatest threat until the sun has its next hiccup in a billion years or more (in the very unlikely scenario that we are still around), (2) that global warming is presently nowhere near being the planet’s most deadly environmental scourge, and (3) that government action and political will cannot measurably or significantly ameliorate global climate in the present world.
I also advance that there are strong societal, institutional, and psychological motivations for having constructed and for continuing to maintain the myth of a global warming dominant threat (global warming myth, for short). I describe these motivations in terms of the workings of the scientific profession and of the global corporate and finance network and its government shadows. I argue that by far the most destructive force on the planet is power-driven financiers and profit-driven corporations and their cartels backed by military might; and that the global warming myth is a red herring that contributes to hiding this truth. In my opinion, activists who, using any justification, feed the global warming myth have effectively been co-opted, or at best neutralized.
The most often cited reconstructed global average temperature curves (themselves somewhat tenuous, see below) show increases in global mean temperature of approximately 0.5-1 C in the last 100 years. Let us compare this to the extremes of temperature to which humans routinely adapt. Humans have thrived in every possible ecological niche on the planet, from deserts to tropical forests to the North Polar Regions, since well before present technological advances. These environments show mean temperature differences of as much as 50 C or more. Many of these environments also show day to night and seasonal differences of as much as 20-50 C. A sudden 0.5-1 C increase in mean annual temperature (not spread over 100 years) would be imperceptible to any human and indeed could barely be detected using all of the methods of the modern scientific enterprise.
In addition, whereas there is evidence of negative consequences to populations from sustained regional cooling (e.g., Europe’s Little Ice Age, 1300-1850 AD) and whereas global ice ages (occurring every 40-100 thousand years or so) clearly have significantly affected human populations, there is no known case of a sustained warming alone having negatively impacted an entire population. If it where not for the global greenhouse effect, the planet would on average be 33 C colder and inhabitable. As a general rule, all life on Earth does better when it’s hotter: Compare ecological diversity and biotic density (or biomass) at the poles and at the equator. Read more here.
By William F. McClenney, P.G. R.E.A.
When I first heard it, I believed it. It made sense. I could see it easily and clearly. And that was a long, long time ago. It seemed counterintuitive that anyone could or would not believe it. It was that seminal. Homo Sapiens would cause the earth to warm, we now call it the Greenhouse Gas theory, and it is now a law (at least in California). But it was just a few years ago as the real hype got going that I had my first cause to question the legality of what would soon be a law. And it happened in the oddest of ways. That occasioned a journey that took me from realization to epiphany to more realizations until I finally got it. I will take you on that journey, if you think you can handle it. But be well advised that due to the Nine Times Rule there is only an 11.1% chance you will be able to follow me.
In an advanced course in Psychology taken some 30 years ago I learned that the human being is nine times more susceptible to rumor than it is to fact. That simple rule explains a dramatic amount of human behavior. To prove this rule all one needs to do is accurately answer this simple question: Which religion is the correct one? That’s what I thought.
So if you want to take the journey I did, brace yourself well. My religion is geology, and this journey is the ultimate heresy. If you make it all the way to the end, and understand it all, you will be amongst a very rare breed, those that made the cut on the Nine Times Rule. And you will know how this fundamental rule has been revised, may possibly be revised again downwards, and why. Because this journey I took, and that you may take, started out about climate change and ended up somewhere else entirely. It ended up as part of the theory of everything.
Icecap Note: What follows is a five part series submitted for our evaluation by William F. McClenney, Professional Geologist #4430 (CA) who changed sides during his multi-year, painstaking research into all aspects of anthropogenic versus natural causes of climate changes. In his own words “The results of this research are startling. Not only can I safely state that the chances of AGW occurring due to greenhouse gases (GHG) is remote at best, and if it did occur might very well be the first time in the geologic record, but that GHG theorists are simply on the wrong side of the decimal point in this debate.” You may not agree with everything he says. I didn’t. But it is overall very insightful, interesting and provocative. Part 1 is here. Part II is here. Part III is here. Part IV is here. Finally Part V is here.
Mr. McClenney is a California Licensed Professional Geologist and Registered Environmental Assessor. He was also appointed the first Certified Environmental Auditor in Victoria, Australia in 1991, empowered to sign-off on contaminated site cleanups. He has been investigating and cleaning up hazardous waste sites for 22 years.
By Joseph D’Aleo, CCM
Evidence is growing this La Nina will be a longer term event. Most similar important La Ninas are often multi year events (1949-1951,1954-1956, 1961-63, 1970-1972, 1973-1976, 1998-2001). Though the easternmost Pacific near South America has warmed at the surface as the seasonal weakening of the tropical easterlies led to weakened upwelling, it is still cold beneath. Below you can see the latest depth-section of ocean temperatures (top) and anomalies (bottom). Temperature are in degree Celsius. Note the large reservoir of subsurface anomalously cold water (up to 4 degrees C) in the eastern tropical Pacific at 50 to 100 meters.
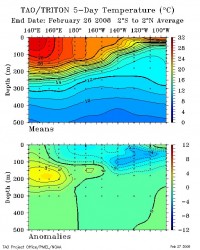
See larger image here
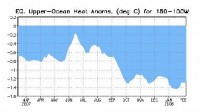
Also see the latest CPC depicted ocean heat content in the tropical Pacific. This shows the heat content remains at near maximum deficit levels.
See larger image here
These suggest as the easterlies increase again, cooling will return to the east Pacific and La Nina will persist at least well into 2008. The Pacific Decadal Oscillation (PDO) has dropped strongly negative (latest value from NCEP is -1.54 STD). This decline may represent another Great Pacific Climate Shift as the PDO warm and cold phases tend last 25 to 30 years and the last change , to a warm Pacific, occurred in 1976. See more in this pdf here. If indeed the PDO shift is the real deal, we might expect more La Ninas and fewer weaker El Ninos over the next few decades with a net tendency for cooling. Add to that a quieter sun and eventually a cooling Atlantic, and you have a recipe for global cooling.
However, this has its own drawbacks, La Ninas bring more drought and summer heat waves, landfalling hurricanes, large tornado outbreaks, spring floods, winter snows and cold outbreaks than their more famous counterpart, El Nino, which has dominated during the warm PDO era. A while back, Stan Changnon did an interesting analysis which I reported on recently here that suggests the era we have gone through since the late 1970s with dominant El Ninos was unusually benign with more benefits than damages and will be looked on as the golden era, a modern climate optimum. Even if all this is correct, you might expect the media and enviro-alarmists ‘evidence’ we are affecting our climate to morph from warming and ice melt to the climate extremes characteristic of La Ninas. See full pdf here.
By Dr. Lance Endersbee
In the fifteenth and sixteenth centuries the climate in Europe was cold and unpredictable. Crops failed. Famine followed famine, bringing epidemics. There was a belief that crop failures must be due to human wickedness. But who were the wicked ones? It was believed that there must be some witches who are in the grip of the devil. Witches were named, Inquisitors tested their faith, and a large number of poor souls were condemned and burnt at the stake. For decade after decade, fires burned in most towns in Europe. It is an example of a public delusion. In 1841, Charles MacKay wrote a book, Extraordinary Public Delusions and the Madness of Crowds. It has been reprinted. MacKay describes several popular delusions such as The South-Sea Bubble, The Tulipmania, The Crusades, and The Witch Mania. We read it today with a detached amusement, but there have been many other popular delusions since MacKay wrote his book. We are not immune to the madness of crowds.
Today, there is global warming. The droughts and warm weather are regarded as punishment for the environmental sins of mankind. The particular cause is claimed to be the use of carbon fuels. Over the past two decades the concepts of man-made global warming and man-made climate change have come to be accepted as reality. It is repeated every day, in the papers, on TV, in schools and universities. Many governments, and the United Nations, have declared their faith that Man is causing global climate change. But is it true, or is it just another extraordinary popular delusion?
Many scientists, engineers, farmers and others around the world have sound reasons to believe that global climate change has natural causes, but there is little learned discussion. The reason is that climate change has now become a political and economic issue, and is no longer a scientific issue. Read more here.
Emeritus Professor Lance Endersbee is former Dean of Engineering and former Pro-Vice Chancellor of Melbourne, Australia’s Monash University.
‘Science’ - Environmentalism’s Fig LeafBy Climate Resistance
On The Nation blog, David Roberts of Gristmill (another blog) writes: Long-time greens are painfully aware that the arguments of global warming skeptics are like zombies in a ‘70s B movie. They get shot, stabbed, and crushed, over and over again, but they just keep lurching to their feet and staggering forward. That’s because—news flash!—climate skepticism is an ideological, not a scientific, position, and as such it bears only a tenuous relationship to scientific rules of evidence and inference.
Let us put him straight. Climate scepticism (or skepticism) is not an ideological position. Climate scepticism is not an ideology. Climate scepticism does not offer a perspective on the world from which follow moral imperatives, and climate scepticism is not a doctrine, around which climate sceptics wish to organise society. There is no “world view” of climate scepticism. Environmentalism,on the other hand, is an ideology. It does create moral imperatives. It does wish to organise society around its principles. It is a world view. Of course, climate orthodoxy and environmentalism can be challenged from political or ideological perspectives. But there is no consistent “climate sceptic” position. There doesn’t need to be; It’s not an argument for a course of action, and its objections to environmentalism are varied. There have been criticisms of climate politics from the left, and from the centre (or center), and from the right. But these perspectives are not unique to climate scepticism.
To make his point, Roberts links back to a March ‘07 post of his on Gristmill, where he makes the claim that, the scientific contest, at least as it relates to the basic facts of global warming, is over. If the science is settled, he reasons, then the idea that “The contest between climate advocates and their critics is primarily a scientific contest, a debate over who has the best science” is false. By elimination, the argument with no science must be political. Of course, both of Roberts’s premises are false. The scientific debate is not over - it’s never over, and can never be over. That is itself an unscientific statement. Read more here.
By Joseph D’Aleo, CCM
Why the current cooling is likely just the start!
Although, I believe the sun is likely the primary driver for the changes to global climate, the oceans may provide the mechanisms for the changes on year-to-year to multidecadal time scales. In a prior analysis, we had shown how the sun and oceans correlated better with US temperature changes than carbon dioxide over the last century. The oceans had the strongest correlation. In this analysis, we will present evidence for how and why the oceans affect temperatures.
The oceans warm and cool much slower than land for a number of reasons. (1) The sun is able to warm only the thin upper surface of the land directly while it may penetrate many meters into the ocean; (2) The ocean like the air but unlike land is subject to vertical mixing and convective movements; (3) The thermal capacity of the oceans is much higher because the water has roughly four times the specific heat (the amount of heat required to warm a given volume 1 degree Celsius) as most land surfaces. This is why land warms more and much faster than the ocean in the spring and cools more and faster in the fall.
As John Brignell has noted, one consequence of the ocean’s ability to absorb more heat is that when an area of ocean becomes warmer or cooler than usual, it takes much longer for that area to revert to “normal” than it would for a land area. Also because of the huge discrepancy in volumetric thermal capacities, the influence of water on air is very much greater and more immediate than air on water. A change in atmospheric temperatures might take decades to affect the oceans, but the flip of an anomaly of an ocean pool of water has an almost immediate effect on the air. Although ocean temperature anomalies tend to persist for long periods, there are large-scale oscillations or flip-flops that take place on scales of a few years to multiple decades. These oscillations have profound effect on global temperatures. This can be seen with the El Ninos and La Ninas.
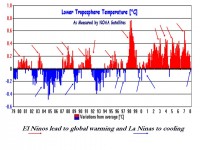
See larger image here
In this post, we will look further into the ENSO effects and also show how the longer term multidecadal PDO affects El Nino and La Nina frequency and through that the global temperature tendencies. And we end with a look ahead with changes underway to the sun and ocean.
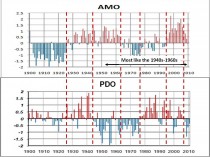
See larger image here
See full blog here.
Posted by Paul Biggs on the Jennifer Marohasy Blog
According to Lance Endersbee:
The CO2 levels in the atmosphere are damped by the oceans. The oceans are a huge source and sink for volatile gases. The surface area of the oceans is vast in relation to the depth of the oceans and the atmosphere. Thus we are dealing with a surface phenomenon.
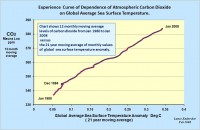
See larger graph here.
The above chart is an actual experience curve relating actual CO2 levels with actual global average sea surface temperatures. It is not a time scale, just the simple relation between two physical parameters. The line is made up of the succession of actual monthly plotted points. If we have regard to the possible errors of measurement of CO2 and SST, it is remarkably consistent. The clear relationship is what would be expected from solubility data. It is only evident in the temperature data from satellite sources. The 21 year moving average covers the double solar cycle, including the change in solar polarity. It also covers El Nino and La Nina events. It also recognizes the longer response time of the oceans. This chart proves that human emissions of CO2 cannot accumulate in the atmosphere. They are scavenged as they occur. We can use the chart to predict the decreased levels of CO2 that will result from cooling.
From Joe D’Aleo:
Below is the monthly Hadley land and ocean and UAH MSU lower tropospheric temperatures over the last decade plotted with the CO2. Note the temperatures have not warmed, something even IPCC’s head Dr. Rajendra Pachauri took note of (paraphrasing him - as for the plateauing of temperatures in recent years, we have to see if there are natural factors offsetting greenhouse gases). Note the correlation with CO2 has vanished the last decade for both data sets.
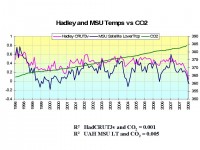
See larger graph here.
Aside from the brief bounce coming out of the moderate/strong La Nina of 1999, there has been no increase despite the steady climb of CO2. If we were nearing that ‘tipping point’ Hansen and Gore love to talk about, surely, a decade is not too short a period to expect some thermal response to CO2 increases. See Jennifer’s Blog here. For more on the oceans’ role compared to CO2 see this earlier blog (updated).
By Joe D’Aleo, CCM
A big surge of snow in many parts of the Northern Hemisphere in the last half of January resulted in January being the snowiest for the hemisphere since satellite records began in 1966.
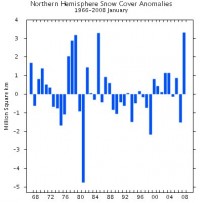
See full size image here
After some retreat, a second surge took place this month and again now, the snowcover is well above the normal for the month. Data comes courtesy of Dr. Bob Hart, FSU.
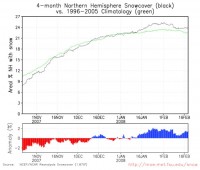
See full size image here
This may result in February again being among the snowiest for the hemisphere for the period of record. It will be a few weeks before that analysis is provided. Extensive snowcover in mid to late winter, something lacking in most recent years often means colder and snowier than normal temperatures for late winter and a delayed spring. Look for more snow events and late potentially damaging cold in the news in the days, weeks and months ahead. This mirrors the happenings in the Southern Hemisphere their last winter and spring. Our South American friends at the METSUL had predicted this outcome for us.
See this story today from North Dakota where long-time cold records were set. Fargo broke a record that had stood for 119 years, with 31 below. The record had been 30 below set in 1889. Madison, Wisconsin where their new record seasonal snowfall has climbed to 86.7 inches (and will climb well above 90 next week on its inexorable trek to 100 inches) set a new record with minus 15F. In Chicago, temperatures are on pace to make it the 4th coldest winter in the last 20 years.
By Anthony Watts, Watts Up With that
The global surface temperature anomaly data from the UK Hadley Climate Research Unit has just been released, and it shows a significant drop in the global temperature anomaly in January 2008, to just 0.034C, just slightly above zero. This caps a full year of temperature drop from HadCRUT’s January 2007 value of 0.632C.
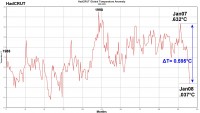
See larger image here.
The change in temperature for the year then is 0.595C which is in line with other respected global temperature metrics that I have reported on in the past two weeks. RSS, UAH, and GISS global temperature sets all show sharp drops in the last year. We are in an extended solar minimum, we have a shift in the Pacific Decadal Oscillation to a cold state, and we are seeing arctic ice extents setting new records and rebounding from the summer melt. While weather is defined as such variability, the fact that so many things are in agreement on a global scale in such a short time span of one year should give us pause. See Anthony’s blog here.
Icecap Note: You have access to all the data sources in our Climate Library Resource section with this link.
How Not to Measure Temperature, Part 52: Another UFA Sighted in ArizonaBy Anthony Watts, Watts Up With That
My post How not to measure temperature, part 51 was also cross posted over at Climate Audit, and has created quite a stir when Atomz, a climate scientist at the University of Arizona, tried to demonstrate that the temperature spike shown in the GISS data at Lampasas, TX, was not due to the relocation next to a building and asphalt parking lot, but rather some problem with GISS algorithm to do homogeneity adjustment to the data.
Steve McIntyre had doubts and posted a tongue in cheek rebuttal where he blamed the problem on UFA’s (Unidentified Faulty Algorithms). It seems reasonable given the fact that Arizona is already the center of surface measurement weirdness given the parking lot weather station operated by the Atmospheric Science Department of the University of Arizona. Enter serendipity. Warren Meyers son Nicolas, has been actively surveying Arizona stations for his school science project. My inbox had a new station from him today, Miami, AZ. So I decided to take a look at it. As is typical when an MMTS sensor gets installed by NOAA/NWS to replace the traditional Stevenson Screen, it got closer to human habitation, and in this case, a LOT closer. Too close I’d say.

See full size here
So I though I’d take a look at the raw GISS temperature plot for Miami, AZ to see if the move would show a spike, it did. (Anthony overlaid the homogenized NASA GISS data after adjustment over the raw data as he had done with Lampasas, Texas.)
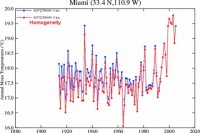
See full size graph here
Notice that after the GISS homogeneity adjustment, the past temperatures go down, thus making the slope of the temperature trend rise. The rise is purely artificial, and appears to be an artifact of data adjustment by NASA GISS on this rural station.
In a comment on the subject, Steve Mosher offers an explanation: “In Hansen 2001 Hansen says he uses nightlights to determine if a station is Rural in the US and population everywhere else. Miles city population is less than 10K which makes it rural, BUT, nightlights (satellite imagery taken in 1995) indicates a brightness factor for Miles of 26! effectively making it urban.”
I concur, there appears to be a flaw in the GISS nightlines methodology and adjustment algorithm. I look forward to seeing GISS investigate, and if this problem is indeed verified, a dataset correction. See full post here.
UPDATE: see yet another example of the GISS adjustment issue for a rural station with a good record and little in the way of station moves, and that had changed little in 100 years, Cedarville, CA here.
Tornadoes Not a Sign of Global WarmingBy Dr. Tim Ball in the Canada Free Press
In his book State of Fear, Michael Crichton wrote about exploitation of fear by environmental extremists. He should write another book about exploitation of lack of knowledge. Climate and environment were previously outside of politics, but once they became potential election issues politicians exploited them better than environmentalists. It fulfills H.L Mencken’s observation that, “The whole aim of practical politics is to keep the populace alarmed (and hence clamorous to be led to safety) by menacing it with an endless series of hobgoblins, all of them imaginary.”
So before anyone attempts to make political gain from the tragic events of the tornados that killed people across the southern US recently, let’s put the science on the record. And while we’re at it let’s explode another false claim that storms and severe weather will increase with global warming.
Storm and accompanying tornadoes that caused the recent deaths were partly created by increased warm moist air off the Gulf of Mexico as a result of La Nina. This influx of warm moist air is needed to meet with the cold air that pushes far south, as it has all this winter. It will continue to do as the Earth continues to cool, as it has generally since 1998. The dilemma then is that storms will most likely increase in frequency and severity, but it will be because of global cooling, not warming.
Proponents of the anthropogenic global warming hypothesis have positioned themselves to continue to claim they are right no matter what ultimately happens. They switched from calling it ‘global warming’ to ‘climate change’ as the concern as global temperatures began to decline while carbon dioxide levels increased. This position produces incredible statements that merely demonstrate ignorance such as Greenpeace climate spokesperson Steven Guilbeault’s comment, “Global warming can mean colder, it can mean drier, it can mean wetter, that’s what we’re dealing with.” Unfortunately most of the public are not yet knowledgeable about the issue to know how silly Guilbeault’s comment is, but they’re learning. Read more here.
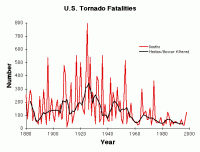
See larger graph here.
Dr. Timothy Ball is a Victoria, British Columbia-based environmental consultant, former climatology professor at the University of Winnipeg, and Chairman of the Natural Resources Stewardship Project .
By Joseph D’Aleo, CCM
A warm wedge of air that brought rain and very mild temperatures even to the nation’s midsection for a day this weekend and to the east today will be moving off the coast today and cold arctic air will again follow. You can see it beginning to pour into the northern plains now.
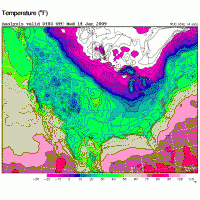
It will like most of the arctic air the last two months focus most in the central states to start but will be felt to a greater extent further east in a day or so with less of the moderation seen with earlier outbreaks. As is typical in many La Nina years, the cold can expand more into the east and the storms that were mainly snow early and mainly a messy mix or rain of late will tend back towards snow again as we move towards and into March. The last La Nina in 2000/01 brought very heavy snows to much of the country in November and December and then parts of the northeast late in the winter. This was my street in central New England in mid March of 2001 after two successive 24 inch snowstorms. Not promising the same this year, but I do expect more snow reaching the northeast just as it did early.
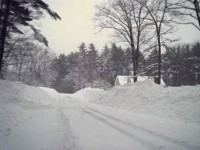
Regardless this winter will be one of the snowiest winters in some time for the nation as a whole although many in the Mid-Atlantic up to southern New England have felt left out (or overjoyed if you dislike snow). You will probably get some late chances here in the weeks ahead along with many other areas that were hoping winter would go away quietly (see snowfall map of the midwest develop by the ISU Mesonet here).
By Alan Caruba, USADaily
I can understand why people believe that global warming is real and that all the things Greens say are true. One cannot read a newspaper or magazine, turn on the television or radio, without getting the Green message. Since switching their message in the 1970s that an Ice Age was coming to the complete fiction of a massive, dramatic global warming due to greenhouse gases, the Greens have been able to influence policy at the international and national level. They have been utterly relentless, a modern version of the Mongols on horseback who swept out of the East to conquer everything before them until the reached the gates of Europe. These days the Greens have long since conquered Europe. One thing alone stands against the Greens. The SCIENCE does not support them.
Dr. Oleg Sorokhtin, Merited Scientist of Russia and fellow of the Russian Academy of Natural Sciences, is staff researcher of the Oceanology Institute. He recently published a commentary asserting that a global cold spell could replace global warming. Note that the Earth has been warming-about one degree Fahrenheit-since the last mini-Ice Age ended around 1850. “The real reasons for climate change are uneven solar radiation”, said Dr. Sorokhtin, while citing others that include the Earth’s axis gyration and instability of oceanic currents.
Large numbers of scientists have sold their soul to the global warming lies in order to receive millions in research grants, but increasingly other scientists have been coming forth to tell the truth. On March 2-4, several hundred will convene in New York for the 2008 International Conference on Climate Change to offer papers and serve on panels disputing and debunking the global warming hoax.
Beyond the climatic threat of a cooling planet is the one posed by U.S. politicians and their counterparts in Europe who are seeking to impose all manner of regulation and limits on energy use based on the false assertion that greenhouse gas emissions are causing global warming. They want to mandate a “cap-and-trade” scheme that will make some people and industries wealthy selling credits that will permit greenhouse gas emissions. But it is not greenhouse gases we need to fear, it is the action or, in this case, the inaction of the Sun. At the very moment the Earth is on the cusp of what is likely to be a very long cooling and possibly a full scale repeat of the last Ice Age, all the engines of government, nationally and internationally, are trying to inhibit the discovery, extraction, and use of energy reserves that will be needed to cope with climate changes that will impact millions and, ultimately, billions of people. All the wind turbines and solar panels in the world will not keep you warm in your home or apartment when a short or long term cooling of the Earth occurs. Ironically, as the Greens rant about so-called endangered polar bears in the Arctic, the bears are far more likely to survive than humans. Read more here.
NASA Earth Observatory
Biting cold seized much of southwest Asia throughout January and into February 2008. This image illustrates how much colder temperatures were between January 17 and January 24, 2008, compared to previous years. The image shows land surface temperatures - how cold or hot the land is to the touch- compared to average land surface temperatures in January 2000-2005 and 2007. (Data from 2006 were unavailable at the time of this posting.) In 2008, land surface temperatures were as much as 20 degrees Celsius cooler than in previous years. The overall blue tone of the image reveals cold temperatures throughout the region, but the most intense cold was in Iran, Afghanistan, Turkmenistan, Uzbekistan, and Tajikistan.
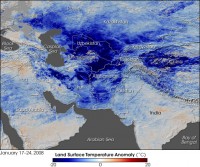
See full image here
The extreme winter conditions were the worst in decades in both Afghanistan and Tajikistan. In Afghanistan, the cold left more than 750 people and 230,000 cattle dead, reported Reuters. Many families rely on cattle for food security, and their loss will likely cause great hardship. Tajikistan was similarly taxed by the severe cold. Even as cold temperatures increased the demand for electricity, power production decreased when inlet streams feeding hydroelectric power plants froze, said the United Nations Office for the Coordination of Humanitarian Affairs on February 11. Tajikistan derives 76 percent of its electricity from hydropower, said the UN. The power shortages left urban areas without heat.
See also the Planet Earth story on the true impact of the worst winter in living memory for this region here.
How Not to Measure Temperature, Part 51By Anthony Watts, Watts Up With That
This NOAA USHCN climate station of record #415018 in Lampasas, TX was found to be tucked between a building, and two parking lots, one with nearby vehicles. According to the surveyor, it is right next to the ACE Hardware store on the main street of town.

While likely representative of the temperature for downtown Lampasas, one wonders how well it measures the climate of the region. In her survey, volunteer surveyor Julie K. Stacy noted the proximity to the building and parking, which will certainly affect Tmin at night due to IR radiance. Daytime Tmax is likely affected by the large amount of asphalt and concrete in the area around the sensor. The main street of the town (28 ft from US 183) and the ACE Hardware parking. According to MMS, station has been at this location since 10-01-2000. Previous location was an observer residence, which appears to have been a park-like location according to MMS location map. The sensor was apparently converted to the MMTS style seen in the photo in 1986, so the move did not include an equipment change. See the complete survey album here.
Since there has been some discussion about how well “adjustments” take care of such problems, I thought I’d show you just how well the GISS homogeneity adjustment works with this station.
Here is the GISS raw data plot (blue) with the GISS homogeneity plot overlaid on it (red):
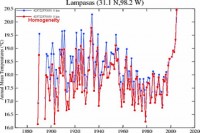
See full size image here.
The effect is quite clear. The recent “spurious” measurement remains unchanged, and the past gets colder. The result? An artificial warming trend that is created by GISS adjustments. See full post here.


